enter()
昨天我們已知 enter 資料類型的定義是當綁定資料時,選取元素不足以綁定時,該筆資料類型會被分類為 enter 類型。
因此,我們可以透過綁定一個頁面上沒有的元素類別,利用 enter()找出不夠資料塞入的元素筆數,再透過 append() 函式新增元素:
1
2
3
4
5
6
7
8
9
| let sampleData = ['a','b','c']
d3.select('body')
.selectAll('div')
.data(sampleData)
.enter()
.append('p')
.text(function(d){
return d
})
|
最後畫面上就會顯示三筆剛透過 append() 產生的資料:
這三筆資料在 HTML DOM 中的結構:

現在我們再把他與 SVG 標籤圖形結合,透過 D3.js 新增一個 SVG 畫布:
1
2
3
4
5
| let sampleData = [10,20,30]
let svg = d3.select('body')
.append('svg')
.attr('width',500)
.attr('height',500)
|
再將資料綁定在 SVG 中的圖形標籤上並產生圖形,這裡的範例是用上次講解到的圓形標籤 <circle>,透過 attr() 來依序將屬性給予 <circle> 以供網頁瀏覽器渲染:
1
2
3
4
5
6
7
8
9
10
11
12
| svg.selectAll('circle')
.data(sampleData)
.enter()
.append('circle')
.attr('cx',function(d,i){
return (i+1)*100
})
.attr('cy',100)
.attr('r',function(d){
return d
})
.style('fill','red')
|
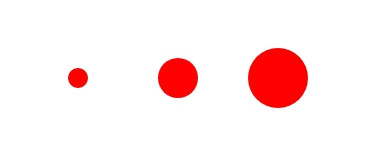
最後網頁瀏覽器渲染出的樣子:
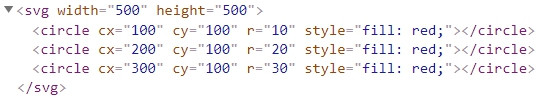
在 HTML DOM 中的結構:
exit()
exit() 用法與 enter() 類似,差異在於我們需要透過 remove() 來刪除 exit() 所篩選出來的多餘元素。
同樣以上方的例子做參考:
1
2
3
4
5
6
7
8
9
10
11
12
13
14
15
16
17
18
19
20
21
22
23
24
25
26
| let sampleData = [10,20,30]
let svg = d3.select('body')
.append('svg')
.attr('width',500)
.attr('height',500)
svg.selectAll('circle')
.data(sampleData)
.enter()
.append('circle')
.attr('cx',function(d,i){
return (i+1)*100
})
.attr('cy',100)
.attr('r',function(d){
return d
})
.style('fill','red')
let sampleData2 = [10,20]
svg.selectAll('circle')
.data(sampleData2)
.exit()
.remove()
|
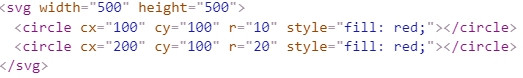
最後網頁瀏覽器渲染出的樣子,可以看到最右邊的圓形已經消失了:

同樣再來觀察 HTML DOM 的狀態,可以確認該圓形標籤是直接從 HTML DOM 上移除的,並非使用 CSS 樣式來消失該元素:
update
在 D3.js 中,update 類型的資料會直接覆蓋到對應的元素上,並且將舊的數據資料 __data__ 直接替換成新的數據資料,所以 updata 類型的資料並不需要特地去操作,若如果需要利用新的數據資料來更動原本的圖表的作法只能依靠重新繪製一次新的圖表。
而目前 D3.js 並沒有方法驅動重新繪製圖表這件事情,因此比較好的做法是自己做一個可以重繪的方法來處理,以供資料變動時可以直接重複利用 D3.js 繪製圖形的程式碼:
1
2
3
4
5
6
7
8
9
10
11
12
13
14
15
16
17
18
19
20
21
22
23
24
25
26
27
28
29
30
31
32
33
34
35
36
37
38
39
40
41
42
| let sampleData = [10, 20, 30];
let svg = d3
.select("body")
.append("svg")
.attr("width", 500)
.attr("height", 500);
function draw() {
let circle = d3.select("svg").selectAll("circle");
let update = circle.data(sampleData);
let enter = update.enter();
let exit = update.exit();
update
.attr("cx", function(d, i) {
return (i + 1) * 100;
})
.attr("cy", 100)
.attr("r", function(d) {
return d;
})
.style("fill", "red");
enter
.append("circle")
.attr("cx", function(d, i) {
return (i + 1) * 100;
})
.attr("cy", 100)
.attr("r", function(d) {
return d;
})
.style("fill", "red");
exit.remove();
}
draw();
sampleData = [5, 30];
draw();
|
原本瀏覽器渲染後的圖:

啟動 draw 函式後渲染的圖:

如此一來若是 sampleData 資料有變更時,只要重新啟用 draw 函式就能將舊有資料去除後重新繪製新一筆的圖。
然而……事情並沒有阿橘想像中這麼快就結束……
阿橘:蝦……蝦咪!?